
Nuance Private Accounts
Nuance Concentrated Value
| Sector Allocation | as of 6/30/2026 | |
|---|---|---|
| GICS® Sectors | Nuance Concentrated Value Composite | Russell 3000 Value Index |
| Cash | 9.4 | 0.0 |
| Communication Services | 0.0 | 3.3 |
| Consumer Discretionary | 5.9 | 10.6 |
| Consumer Staples | 37.1 | 7.3 |
| Energy | 0.0 | 5.5 |
| Financials | 1.2 | 19.5 |
| Health Care | 19.7 | 12.5 |
| Industrials | 6.6 | 11.4 |
| Information Technology | 2.1 | 18.1 |
| Materials | 3.1 | 3.8 |
| Real Estate | 0.8 | 3.9 |
| Utilities | 14.0 | 4.0 |
Note: Sector Classifications are generally determined by referencing the Global Industry Classification Standard (GICS®) Codes developed by Standard & Poor’s and Morgan Stanley Capital International. Sector Allocations are a percent of equity investments and subject to change. Sector Allocation provided by FactSet.
| Portfolio Characteristics | as of 6/30/2026 | |
|---|---|---|
| Nuance Concentrated Value Composite | Russell 3000 Value Index | |
| Weighted Average Market Cap | 21.4b | 657.3b |
| Median Market Cap | 10.5b | 2.8b |
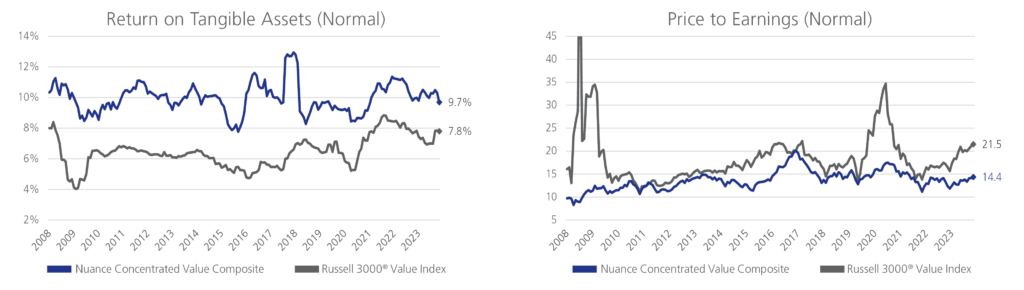
| Price to Earnings (Normal)* | 13.9x | 22.5x |
| Price to Earnings (Ex-Neg Earnings) | - | 20.8x |
| Dividend Yield | 2.4% | 1.7% |
| Return on Tangible Assets (Normal)* | 11.4% | 10.0% |
| Return on Tangible Assets (Trailing) | 9.5% | 10.0% |
| Return on Assets (Normal)* | 8.6% | 8.2% |
| Return on Assets (Trailing) | 7.1% | 8.2% |
| Number of Securities | 32 | 2,276 |
* Based on Nuance normalized earnings estimates.
Index statistics are provided by FactSet. The following characteristics are calculated using FactSet data: Weighted Average Market Cap, Median Market Cap (midpoint of market capitalization of the stocks in the portfolio), Dividend Yield (annual dividends relative to share price), Return on Tangible Assets (net income divided by tangible assets), Return on Assets (net income divided by total assets), P/E (price of a company’s stock relative to its earnings per share). Characteristics for P/E and Dividend Yield use an index aggregation calculation methodology (the index method sums the weighted portfolio value of the numerator and the denominator first, then divides those sums to determine the portfolio and benchmark values). ROTA and ROA characteristics for the benchmark use FactSet net recurrent earnings (T12M). The weighted average ROTA and ROA number for both the portfolio and the benchmark is displayed. Characteristics calculations use holdings at market close on the stated date, including cash & cash equivalents. The P/E excluding negative earners omits companies with negative earnings from the calculation to provide readers with an additional tool during periods of extreme volatility.
| Portfolio Guidelines | |
|---|---|
| Capitalization | All-Cap |
| Cash Limits1 | 25.00% |
| International Limits2 | 25.00% |
| Diversification Limits | 50.00% of the portfolio assets will not have positions of greater than 5.00% |
| Maximum Position | 15.00% |
| Industry Constraints3 | 25.00% |
| Number of Companies4 | 15 to 35 |
| Absolute Volatility | Less than the S&P 500® Index |
| Peer Group | All-Cap Value |
| Primary Benchmark | Russell 3000® Value Index |
| Secondary Benchmarks | S&P 500® Index |
| Tracking Error | Approximately 350-1000 bps |
| Performance Focus | Absolute Return & Sharpe Ratio vs. Russell 3000® Value Index and S&P 500® Index |
| Top 10 Holdings % of Net Assets | as of 6/30/2026 |
|---|---|
| Beiersdorf AG Unsp ADR | 11.1 |
| Clorox Company | 10.2 |
| QIAGEN NV | 9.7 |
| California Water Service Group | 6.4 |
| Kimberly-Clark Corporation | 5.1 |
| Henkel AG & Co. KGaA Sp ADR | 4.8 |
| Kenvue, Inc. | 4.7 |
| Taylor Morrison Home Corporation | 4.7 |
| Solventum Corporation | 3.4 |
| AptarGroup, Inc. | 3.1 |
Note: Holdings are subject to change. For a complete list contact Nuance Investments.
Nuance Investments, LLC (the “Firm”) is a Registered Investment Advisor. The Firm’s Nuance Concentrated Value Composite (the “Composite”) is a composite of actual accounts invested in the Nuance Concentrated Value investment strategy. The creation and inception date for the Composite is 11/13/2008. The Composite includes all accounts that have invested in the strategy; including accounts no longer managed by the Firm and are presented in US Dollars. Actual account returns may be higher or lower than the Composite returns due to differences in portfolio holdings, timing of security transactions, and account inception date. The Primary Benchmark for the Composite is the Russell 3000 Value Index. The Russell 3000 Value Index measures the performance of the broad value segment of the U.S. equity universe. It includes those Russell 3000 companies with lower price-to-book ratios and lower forecasted growth values. The Secondary Benchmark for the Composite is the S&P 500 TR Index. The S&P 500 TR Index is a market-value weighted index representing the performance of 500 widely held publicly traded large-capitalization stocks. Individuals cannot invest directly in any index. Indices are used for comparison purposes only, do not include the reinvestment of dividends, and are not meant to be indicative of a portfolio’s performance, asset composition, or volatility.
The performance of the Composite may differ markedly from that of compared indices due to varying degrees of diversification and/or other facts.
Return calculations for the Composite are provided by Clearwater Analytics. Return calculations for all indices are provided by FactSet. The collection of fees has a compounding effect on the total rate of return net of investment management fees. Net of fee performance is presented after all actual investment management fees, performance-based management fees and all trading expenses that may occur. No other fees are deducted aside from trading and management fees for the calculation of net of fee performance. A full schedule of fees for all Firm products is available upon request.
All material presented is compiled from sources believed to be reliable and current, but accuracy cannot be guaranteed. The information contained herein should not be construed as personalized investment advice and should not be considered as a solicitation to buy or sell any security or engage in a particular investment strategy. Investing involves risk, including the possible loss of principal.
(1) The portfolio generally will not exceed a 25% weighting in Cash.
(2) The portfolio may invest up to 25% of its assets in equity securities of foreign companies in countries classified as developed by MSCI. Nuance utilizes FactSet’s country assignments for individual companies. Currently, the following countries are classified as developed by MSCI: Australia, Austria, Belgium, Canada, Denmark, Finland, France, Germany, Hong Kong, Ireland, Israel, Italy, Japan, Netherlands, New Zealand, Norway, Portugal, Singapore, Spain, Sweden, Switzerland, the UK, and the United States.
(3) The portfolio will not exceed a 25% weighting in one industry as defined by GICS® classification standards (GICS®).
(4) A typical portfolio will hold between 15 and 35 companies. This is not a fundamental diversification limit.
Past Performance is not a guarantee of future results. Securities are subject to general market risks due to a variety of factors that affect the overall market. There is no guarantee that an investment with the strategy will meet its investment objectives, and it may underperform the market. Please contact client.services@nuanceinvestments.com to request a copy of the Firm’s Disclosure Brochure for more information.
Nuance Investments, LLC • 4900 Main Street, Suite 220, Kansas City, MO 64112