
Awards | Nuance Concentrated Value
| Morningstar Ratings | ||
|---|---|---|
| Category | Overall Rating1 | |
| Nuance Concentrated Value Separate Account | Mid-Cap Value | |
| 1Out of 149 separate accounts, as of 03/31/25 |
The top 10% of separate accounts in a category receive 5 stars, the next 22.5% receive 4 stars.
Nuance pays a licensing fee for the right to use and display third party rankings and awards. Nuance does not pay for participation or inclusion in third party rankings. The ratings are not representative of any one client’s experience and are not indicative of Nuance’s future performance.
The Morningstar RatingTM for funds, or “star rating”, is calculated for separate accounts with at least a three-year history. It is calculated based on a Morningstar Risk-Adjusted Return measure that accounts for variation in a managed product’s monthly excess performance, placing more emphasis on downward variations and rewarding consistent performance. The top 10% of products in each product category receive 5 stars, the next 22.5% receive 4 stars, the next 35% receive 3 stars, the next 22.5% receive 2 stars, and the bottom 10% receive 1 star. The Overall Morningstar Rating for a managed product is derived from a weighted average of the performance figures associated with its three-, five-, and 10-year (if applicable) Morningstar Rating metrics. The weights are: 100% three-year rating for 36-59 months of total returns, 60% five-year rating/40% three-year rating for 60-119 months of total returns, and 50% 10-year rating/30% five-year rating/20% three-year rating for 120 or more months of total returns. While the 10-year overall star rating formula seems to give the most weight to the 10-year period, the most recent three-year period actually has the greatest impact because it is included in all three rating periods.
Notes: Morningstar uses gross-of-fee performance (before fees have been taken out) to compare separate accounts. Morningstar does not calculate ratings for categories or time periods that contain fewer than five separate accounts. To ensure that ratings are fairly assigned, Morningstar will calculate ratings for only those firms that report performance for “composites” of similarly managed portfolios according to the guidelines of the CFA Institute’s Global Investment Performance Standards (GIPS®).
© 2025 Morningstar, Inc. All rights reserved. The information contained herein: (1) is proprietary to Morningstar and/or its content providers; (2) may not be copied or distributed; and (3) is not warranted to be accurate, complete, or timely. Neither Morningstar nor its content providers are responsible for any damages or losses arising from any use of this information. Past performance is no guarantee of future results.
| Rating Date | Morningstar Category | Overall Morningstar Rating™ | Separate Accounts in Category |
|---|---|---|---|
| Q1 2012 | Large Value | 5 | 445 |
| Q2 2012 | Large Value | 5 | 469 |
| Q3 2012 | Large Value | 5 | 462 |
| Q4 2012 | Large Value | 5 | 451 |
| Q1 2013 | Large Value | 5 | 407 |
| Q2 2013 | Large Value | 4 | 405 |
| Q3 2013 | Large Value | 5 | 374 |
| Q4 2013 | Large Value | 5 | 399 |
| Q1 2014 | Large Value | 5 | 396 |
| Q2 2014 | Large Value | 5 | 389 |
| Q3 2014 | Large Value | 4 | 396 |
| Q4 2014 | Mid-Cap Value | 4 | 116 |
| Q1 2015 | Mid-Cap Value | 4 | 122 |
| Q2 2015 | Mid-Cap Value | 4 | 124 |
| Q3 2015 | Mid-Cap Value | 4 | 125 |
| Q4 2015 | Mid-Cap Value | 4 | 130 |
| Q1 2016 | Mid-Cap Value | 5 | 123 |
| Q2 2016 | Mid-Cap Value | 5 | 118 |
| Q3 2016 | Mid-Cap Value | 3 | 128 |
| Q4 2016 | Mid-Cap Value | 3 | 127 |
| Q1 2017 | Mid-Cap Value | 3 | 131 |
| Q2 2017 | Mid-Cap Value | 3 | 128 |
| Q3 2017 | Mid-Cap Value | 3 | 130 |
| Q4 2017 | Mid-Cap Value | 3 | 127 |
| Q1 2018 | Mid-Cap Value | 3 | 123 |
| Q2 2018 | Mid-Cap Value | 3 | 121 |
| Q3 2018 | Mid-Cap Value | 3 | 431 |
| Q4 2018 | Large Value | 5 | 434 |
| Q1 2019 | Large Value | 4 | 454 |
| Q2 2019 | Large Value | 5 | 450 |
| Q3 2019 | Large Value | 5 | 464 |
| Q4 2019 | Large Value | 5 | 472 |
| Q1 2020 | Large Value | 5 | 452 |
| Q2 2020 | Large Value | 5 | 458 |
| Q3 2020 | Large Value | 5 | 447 |
| Q4 2020 | Large Value | 5 | 446 |
| Q1 2021 | Large Value | 4 | 467 |
| Q2 2021 | Large Value | 4 | 470 |
| Q3 2021 | Large Value | 4 | 468 |
| Q4 2021 | Large Value | 3 | 468 |
| Q1 2022 | Large Value | 3 | 473 |
| Q2 2022 | Mid-Cap Value | 5 | 120 |
| Q3 2022 | Mid-Cap Value | 4 | 128 |
| Q4 2022 | Mid-Cap Value | 4 | 125 |
| Q1 2023 | Mid-Cap Value | 4 | 133 |
| Q2 2023 | Mid-Cap Value | 4 | 135 |
| Q3 2023 | Mid-Cap Value | 3 | 135 |
| Q4 2023 | Mid-Cap Value | 3 | 138 |
| Q1 2024 | Mid-Cap Value | 3 | 139 |
| Q2 2024 | Mid-Cap Value | 3 | 144 |
| Q3 2024 | Mid-Cap Value | 4 | 148 |
| Q4 2024 | Mid-Cap Value | 3 | 145 |
| Q1 2025 | Mid-Cap Value | 3 | 145 |
PSN Top Guns
Most Recent Award
Past awards
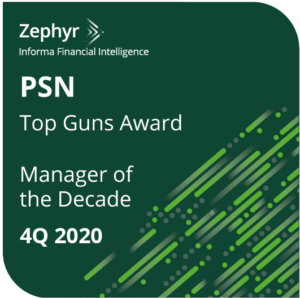
Nuance Concentrated Value Compositeᅠ
Manager of the Decade -ᅠ
All Cap Value Universe
12/31/2020
12/31/2019
12/31/2018
Nuance Concentrated Value Composite
PSN Top Gun Rating –
All Cap Value Universe
4 Star Category 12/31/2013
5 Star Category 12/31/2013
6 Star Category 12/31/2013
4 Star Category 06/30/2014
5 Star Category 03/31/2015
6 Star Category 03/31/2015
5 Star Category 06/30/2015
6 Star Category 06/30/2015
5 Star Category 09/30/2015
6 Star Category 09/30/2015
5 Star Category 03/31/2016
6 Star Category 03/31/2016
4 Star Category 06/30/2016
4 Star Category 03/31/2020
5 Star Category 03/31/2020
6 Star Category 03/31/2020
5 Star Category 12/31/2020
Nuance Concentrated Value Composite
PSN Bull & Bear Masters –
All Cap Value Universe
12/31/2013
Nuance pays a licensing fee for the right to use and display
third party rankings and awards. Nuance does not pay for participation or
inclusion in third party rankings. The ratings are not representative of any
one client’s experience and are not indicative of Nuance’s future performance.
PSN Top Guns ranks products in six proprietary categories in over 50 universes. Top Gun firms are awarded a rating ranging from one to six stars, with the number of stars representing specified performance timeframes and criteria. Criteria descriptions for all categories are provided below. Nuance may receive PSN Top Gun awards across various categories and universes. The awards displayed are unique to the 4 Star, 5 Star and 6 Star Categories in the Mid Cap Value universe for the Nuance Mid Cap Value product and the All Cap Universe for the Nuance Concentrated Value Product. For a full list of awards across all star ratings in all universes and categories, please contact Nuance Investments at 816-743-7080 or
client.services@nuanceinvestments.com
The peer groups were created using the information collected through the PSN investment manager questionnaire and uses only gross of fee returns. PSN Top Guns investment managers must claim that they are GIPs compliant. 1 STAR CATEGORY:ᅠ Top ten performers for the specified quarter. 2 STAR CATEGORY: Top ten performers for the specified one year period. 3 STAR CATEGORY: Top ten performers for the specified three year period. 4 STAR CATEGORY: ᅠProducts must have an R-Squared of 0.80 or greater relative to the style benchmark for the recent five year period. In addition, products must have returns greater than the style benchmark for the three latest three-year rolling periods. Winners are the top ten returns for the latest three-year period. ᅠ5 STAR CATEGORY: Includes products that passed the 4 Star criteria. In addition, products must have a standard deviation for the five year period equal or less than the median standard deviation for the peer group. Winners are the top ten returns for the latest three-year period. 6 STAR CATEGORY: Includes products that passed the 5 Star criteria. Winners are the ᅠtop ten information ratios for the latest five-year period.
Bull & Bear Masters: The peer groups were created using the information collected through the PSN investment manager questionnaire and uses only gross of fee returns. Products must have an R-Squared of 0.80 or greater relative to the style benchmark for the recent three year period. Moreover, products must have an Upside Market Capture ratio of 100 or more, and Downside Market Capture ratio of 100 or less relative to the style benchmark. The top ten Ratios between Upside Market Capture Ratio and Downside Capture Ratio became the PSN Bull & Bear Masters products.
Manager of the Decade Criteria: The PSN universes were created using the information collected through the PSN investment manager questionnaire and use only gross of fee returns. PSN Top Guns investment managers must claim that they are GIPS compliant. Mutual fund and commingled fund products are not included in the universe. Products must have an R-Squared of 0.80 or greater relative to the style benchmark for the latest ten year period. Moreover, products must have returns greater than the style benchmark for the latest ten year period and also Standard Deviation less than the style benchmark for the latest ten year period. At this point, the top ten performers for the latest 10 year period become the PSN Top Guns of the Decade.
The content of the Investment Manager Top Guns is intended for use by qualified investment professionals. Please consult with an investment professional before making any investment using content or implied content from any Investment Manager Top Guns.
All Rights Reserved. The Investment Manager Top Guns is powered by PSN. PSN is an investment manager database and is a division of Informa Investment Solutions. No part of this Investment Manager Top Guns may be reproduced in any form or by any means, electronic, mechanical, photocopying, or otherwise without the prior written permission of Informa Investment Solutions.
Because of the possibility of human or mechanical error by Informa Investment Solutions (IIS) sources or others, IIS does not guarantee the accuracy, adequacy, completeness or availability of any information and is not responsible for any errors or omissions or for the results obtained from the use of such information. THERE ARE NO EXPRESS OR IMPLIED WARRANTIES, INCLUDING, BUT NOT LIMITED TO, WARRANTIES OF MERCHANTABILITY OR FITNESS FOR A PARTICULAR PURPOSE OR USE. In no event shall IIS be liable for any indirect, special or consequential damages in connection with use of any information or derived using information based on any Investment Manager Top Guns results.
How to invest
Nuance has been managing portfolios for individuals and institutions using the same classic value investment philosophy since first registering as an investment advisor in 2008. If you would like to receive material describing our services, including our historical performance records, please contact us.
Nuance Investments, LLC
4900 Main Street, Suite 220
Kansas City, MO 64112
Telephone: (816) 743-7080
Fax: (913) 387-2729
Nuance Investments, LLC • 4900 Main Street, Suite 220, Kansas City, MO 64112